
|
| Comparing the racial diversity of the journalists | ||||||||||
| at America's daily newspapers | ||||||||||
| with the communities that they serve | ||||||||||
| Newsroom diversity report for | ||||||||||
| The New York Sun | ||||||||||
| New York, New York | ||||||||||
| From a report for the Knight Foundation | ||||||||||
| by Bill Dedman and Stephen K. Doig, June 2005 | ||||||||||
| Click here to read the national report or to select another newspaper | ||||||||||
| Year | Non-white % of newsroom staff | |||||||||
| 2005 | Did not report | |||||||||
| 2004 | Did not report | |||||||||
| 2003 | 0.0 | |||||||||
| 2002 | Did not report | |||||||||
| 2001 | Did not report | |||||||||
| 2000 | Did not report | |||||||||
| 1999 | Did not report | |||||||||
| 1998 | Did not report | |||||||||
| 1997 | Did not report | |||||||||
| 1996 | Did not report | |||||||||
| 1995 | Did not report | |||||||||
| 1994 | Did not report | |||||||||
| 1993 | Did not report | |||||||||
| 1992 | Did not report | |||||||||
| 1991 | Did not report | |||||||||
| 1990 | Did not report | |||||||||
| The latest year at peak is | 2003 | |||||||||
| See the notes and definitions section below for the sources of these figures. | ||||||||||
| Newsroom Diversity Index | ||||||||||
| for The New York Sun | ||||||||||
| Year | Non-white % of newsroom staff | Non-white % of circulation area | Newsroom Diversity Index (parity=100) | |||||||
| 2005 | N/A | 20.0 | N/A | |||||||
| 2004 | N/A | 20.0 | N/A | |||||||
| How the index is calculated | ||||||||||
| The Newsroom Diversity Index is the non-white percentage of the newsroom staff | ||||||||||
| divided by the non-white percentage of residents in the circulation area. | ||||||||||
| (Parity = 100.) | ||||||||||
| See the notes and definitions section below for the sources of these figures. | ||||||||||
| Peer group comparison | ||||||||||
| for The New York Sun | ||||||||||
| This paper | ||||||||||
| Peer group | ||||||||||
| The median Diversity Index is 44 for all newspapers | ||||||||||
| reporting in this circulation category of 25,001 to 50,000 daily sales. | ||||||||||
| An example of a newspaper of similar circulation, in an area of similar level of non-white residents, but one that has a relatively high Diversity Index, is The Jackson Sun, Tennessee, with a 37.5 percent non-white staff in a community that is 24.7 percent non-white. Its index is 152. | ||||||||||
| FYI, in circulation, this newspaper's average weekday circulation of | ||||||||||
| approximately 45,763 ranks 232 out of 1,410 daily newspapers in the US. | ||||||||||
| See the notes and definitions section below for the sources of these figures. | ||||||||||
| Details on race/ethnicity | ||||||||||
| in the circulation area | ||||||||||
| and the home county | ||||||||||
| of The New York Sun | ||||||||||
| Circulation area | ||||||||||
| Race/ethnicity | % of population | Number of residents | 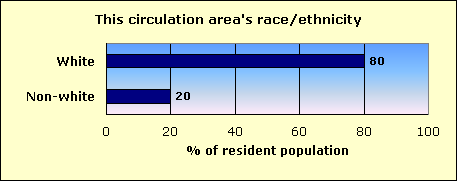
|
|||||||
| Hispanic | 6.7 | 1,387 | ||||||||
| Black | 4.4 | 909 | ||||||||
| Asian and Pacific Islander | 7.2 | 1,495 | ||||||||
| Native-American | 0.1 | 13 | ||||||||
| Other non-white | 0.3 | 59 | ||||||||
| Multi-racial | 1.5 | 302 | ||||||||
| Non-white | 20.0 | 4,165 | ||||||||
| White | 80.0 | 16,678 | ||||||||
| Total | 20,843 | |||||||||
| Home county: New York | ||||||||||
| Race/ethnicity | % of population | Number of residents | 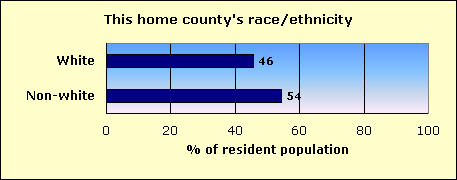
|
|||||||
| Hispanic | 27.2 | 417,816 | ||||||||
| Black | 15.3 | 234,698 | ||||||||
| Asian and Pacific Islander | 9.4 | 143,863 | ||||||||
| Native-American | 0.2 | 2,465 | ||||||||
| Other non-white | 0.4 | 5,536 | ||||||||
| Multi-racial | 1.9 | 28,944 | ||||||||
| Non-white | 54.2 | 833,322 | ||||||||
| White | 45.8 | 703,873 | ||||||||
| Total | 1,537,195 | |||||||||
| The home county of this newspaper is New York. | ||||||||||
| About this report | ||||||||||
| This third annual report for the Knight Foundation adds context to an annual survey by the American Society of Newspaper Editors. ASNE has set a goal that | ||||||||||
| every newspaper, to help it know its community and gather the news, should employ at least one non-white journalist, and that newspapers should strive to | ||||||||||
| employ non-whites in proportion to their share of the community. ASNE's report, at www.asne.org, shows each newspaper's non-white employment, but does | ||||||||||
| not disclose how closely that employment mirrors the newspaper's circulation area. | ||||||||||
| That gap is filled by the report you are reading now. This report was not done by ASNE, but was done for the Knight Foundation by Bill Dedman and | ||||||||||
| Stephen K. Doig. It shows how close each newspaper is to ASNE's goal, by comparing the newsroom staffing with the circulation area population. | ||||||||||
| The full report is at www.powerreporting.com/knight. | ||||||||||
| Notes and definitions | ||||||||||
| 1. The Newsroom Diversity Index is the non-white percentage of the newsroom staff divided by the non-white percentage of the circulation area's residents. Parity = 100. | ||||||||||
| 2. Source for staffing: Survey by American Society of Newspaper Editors, April 2005. Newspapers report non-white staff as of the end of the previous year. | ||||||||||
| 3. Following ASNE's definition, newsroom staff includes only supervisors, reporters, editors, copy/layout editors and photographers. | ||||||||||
| 4. Also following ASNE's definition, "whites," "blacks," etc., exclude Hispanics, who are counted in a separate category. | ||||||||||
| 5. Source for boundaries of this newspaper's circulation area: ZIP Code circulation data, Audit Bureau of Circulations, latest available. | ||||||||||
| 6. A paper may define its circulation area differently for marketing efforts, or news coverage, or to set advertising rates. | ||||||||||
| 7. If ZIP Codes or counties are used, this report applies a threshold: 10 percent household penetration is required to include an area in the circulation area. | ||||||||||
| 8. Source for the demographics of residents of that circulation area: US Census 2000. | ||||||||||
| 9. Source for total circulation: Editor & Publisher magazine, Monday-Friday average at year-end 2004. | ||||||||||
| 10. Staff of non-English publications, such as the Miami Herald's El Nuevo Herald, are excluded from the ASNE staffing survey for the first time this year. | ||||||||||
| Demographics of ZIP Codes | ||||||||||
| where sales were reported by | ||||||||||
| The New York Sun | ||||||||||
| Note that some ZIP Codes listed here may not have been included in determining the newspaper's circulation area. In calculating the Diversity Index, a | ||||||||||
| ZIP Code was included only if the household penetration was at least 10 percent. Any lower-penetration ZIP Codes are also listed here for your information. | ||||||||||
| Also, if the newspaper reported more than 300 ZIP Codes, only the top 300 in weekday sales are listed here. | ||||||||||
| ZIP / City / State / Approx. distance in miles from the newspaper's home office | Weekday sales | Households | Penetration % (daily sales per 100 households) | Median household income | Non-white % of population |
Hispanic % of population |
Black % of population |
Native % of population |
Asian % of population |
|
| 10019 / New York / NY / 3.7 mi. | 1,587 | 22,317 | 7.1 | $55,869 | 36.0 | 17.3 | 5.1 | 0.1 | 10.5 | |
| 10024 / New York / NY / 5.3 mi. | 1,290 | 33,854 | 3.8 | $78,066 | 22.3 | 11.1 | 4.9 | 0.1 | 4.3 | |
| 10023 / New York / NY / 4.5 mi. | 1,240 | 37,486 | 3.3 | $72,424 | 22.6 | 8.4 | 5.0 | 0.1 | 7.1 | |
| 10003 / New York / NY / 1.6 mi. | 967 | 29,516 | 3.3 | $60,891 | 26.7 | 7.6 | 4.1 | 0.1 | 12.1 | |
| 11378 / Maspeth / NY / 5.4 mi. | 836 | 13,096 | 6.4 | $43,107 | 27.7 | 19.1 | 0.5 | 0.1 | 6.0 | |
| 10021 / New York / NY / 4.5 mi. | 756 | 61,774 | 1.2 | $75,472 | 14.1 | 4.7 | 1.4 | 0.0 | 6.4 | |
| 10028 / New York / NY / 5.2 mi. | 743 | 26,113 | 2.8 | $77,565 | 12.0 | 4.2 | 1.2 | 0.0 | 5.0 | |
| 11747 / Melville / NY / 31.7 mi. | 708 | 5,326 | 13.3 | $92,024 | 13.1 | 3.8 | 2.4 | 0.1 | 5.5 | |
| 10017 / New York / NY / 3.2 mi. | 507 | 10,904 | 4.6 | $69,273 | 26.6 | 5.4 | 3.3 | 0.1 | 15.0 | |
| 10048 / New York / NY / 0.1 mi. | 477 | 0 | 0.0 | $0 | 89.1 | 7.3 | 49.1 | 0.0 | 32.7 | |
| 10022 / New York / NY / 3.7 mi. | 283 | 19,780 | 1.4 | $80,406 | 14.1 | 4.8 | 1.2 | 0.0 | 6.6 | |
| 10128 / New York / NY / 5.6 mi. | 225 | 32,800 | 0.7 | $70,031 | 21.9 | 8.7 | 4.4 | 0.1 | 6.7 | |
| 10025 / New York / NY / 5.6 mi. | 208 | 46,296 | 0.4 | $49,733 | 48.3 | 25.1 | 13.7 | 0.2 | 6.4 | |
| 10018 / New York / NY / 2.9 mi. | 192 | 2,061 | 9.3 | $48,705 | 55.5 | 23.2 | 6.5 | 0.3 | 22.0 | |
| 10016 / New York / NY / 2.6 mi. | 182 | 30,719 | 0.6 | $66,342 | 26.9 | 7.9 | 4.8 | 0.1 | 12.0 | |
| 11230 / Brooklyn / NY / 6.8 mi. | 172 | 31,539 | 0.5 | $32,327 | 30.7 | 8.2 | 7.8 | 0.1 | 11.1 | |
| 10014 / New York / NY / 1.3 mi. | 162 | 20,536 | 0.8 | $66,601 | 15.9 | 6.1 | 2.6 | 0.1 | 4.8 | |
| 10036 / New York / NY / 3.3 mi. | 151 | 10,868 | 1.4 | $41,002 | 43.7 | 20.6 | 10.9 | 0.3 | 8.3 | |
| 11215 / Brooklyn / NY / 3.5 mi. | 147 | 27,314 | 0.5 | $53,313 | 42.8 | 26.6 | 6.9 | 0.2 | 5.5 | |
| 10013 / New York / NY / 0.5 mi. | 138 | 10,265 | 1.3 | $38,304 | 58.3 | 4.7 | 4.6 | 0.0 | 45.8 | |
| 11201 / Brooklyn / NY / 1.7 mi. | 138 | 21,544 | 0.6 | $56,293 | 44.0 | 14.4 | 19.4 | 0.1 | 6.8 | |
| 10001 / New York / NY / 2.5 mi. | 130 | 8,941 | 1.5 | $40,932 | 47.1 | 20.1 | 8.3 | 0.2 | 15.3 | |
| 10007 / New York / NY / 0 mi. | 123 | 1,230 | 10.0 | $112,947 | 41.6 | 17.8 | 10.0 | 0.1 | 10.7 | |
| 10010 / New York / NY / 2.2 mi. | 122 | 15,545 | 0.8 | $62,467 | 27.1 | 9.0 | 5.6 | 0.1 | 10.0 | |
| 10011 / New York / NY / 1.9 mi. | 118 | 28,659 | 0.4 | $61,986 | 25.5 | 12.1 | 4.8 | 0.1 | 6.2 | |
| 10020 / New York / NY / 3.4 mi. | 100 | 1 | 10000.0 | $0 | 0.0 | 0.0 | 0.0 | 0.0 | 0.0 | |
| 11219 / Brooklyn / NY / 5.7 mi. | 96 | 26,398 | 0.4 | $26,648 | 33.5 | 11.9 | 0.8 | 0.1 | 16.2 | |
| 11210 / Brooklyn / NY / 6.8 mi. | 94 | 19,986 | 0.5 | $42,967 | 69.4 | 7.2 | 56.0 | 0.1 | 3.2 | |
| 10038 / New York / NY / 0.5 mi. | 91 | 6,596 | 1.4 | $31,316 | 60.8 | 18.0 | 8.1 | 0.1 | 31.7 | |
| 11430 / Jamaica / NY / 12.7 mi. | 91 | 13 | 700.0 | $85,197 | 94.8 | 30.6 | 51.1 | 0.9 | 4.8 | |
| 10012 / New York / NY / 1 mi. | 86 | 13,825 | 0.6 | $58,313 | 31.3 | 7.5 | 2.7 | 0.1 | 18.2 | |
| 11209 / Brooklyn / NY / 6.3 mi. | 84 | 31,511 | 0.3 | $44,518 | 27.7 | 11.0 | 1.4 | 0.1 | 10.1 | |
| 11432 / Jamaica / NY / 11.3 mi. | 82 | 18,201 | 0.5 | $42,414 | 82.4 | 25.3 | 21.7 | 0.5 | 24.4 | |
| 10463 / Bronx / NY / 12.8 mi. | 74 | 27,563 | 0.3 | $40,497 | 58.0 | 38.2 | 12.6 | 0.1 | 4.6 | |
| 10002 / New York / NY / 1.2 mi. | 72 | 31,512 | 0.2 | $24,022 | 84.3 | 26.8 | 6.1 | 0.1 | 49.1 | |
| 10005 / New York / NY / 0.6 mi. | 72 | 524 | 13.7 | $79,517 | 36.8 | 7.4 | 3.2 | 0.0 | 22.9 | |
| 11204 / Brooklyn / NY / 6.7 mi. | 68 | 25,890 | 0.3 | $31,798 | 29.4 | 7.2 | 0.3 | 0.1 | 19.1 | |
| 11354 / Flushing / NY / 10.3 mi. | 66 | 19,587 | 0.3 | $37,155 | 69.1 | 18.9 | 4.0 | 0.1 | 43.2 | |
| 11229 / Brooklyn / NY / 8.5 mi. | 63 | 30,599 | 0.2 | $37,812 | 28.1 | 6.7 | 4.2 | 0.1 | 14.6 | |
| 11220 / Brooklyn / NY / 5.1 mi. | 59 | 28,487 | 0.2 | $30,152 | 81.0 | 46.2 | 2.0 | 0.2 | 28.9 | |
| 11235 / Brooklyn / NY / 9.6 mi. | 59 | 32,129 | 0.2 | $31,013 | 27.4 | 9.5 | 2.1 | 0.1 | 12.7 | |
| 11222 / Brooklyn / NY / 3.5 mi. | 56 | 15,865 | 0.4 | $33,578 | 28.3 | 19.5 | 1.2 | 0.1 | 3.8 | |
| 11218 / Brooklyn / NY / 5.2 mi. | 52 | 25,403 | 0.2 | $36,432 | 52.2 | 19.6 | 11.9 | 0.2 | 14.2 | |
| 11385 / Ridgewood / NY / 6.4 mi. | 51 | 34,852 | 0.1 | $36,434 | 48.1 | 37.9 | 1.3 | 0.1 | 6.2 | |
| 11375 / Forest Hills / NY / 8.6 mi. | 50 | 33,256 | 0.2 | $51,350 | 35.5 | 10.2 | 2.2 | 0.1 | 20.0 | |
| 10009 / New York / NY / 1.8 mi. | 49 | 29,144 | 0.2 | $40,176 | 51.8 | 30.2 | 8.5 | 0.2 | 10.1 | |
| 10301 / Staten Island / NY / 7.2 mi. | 48 | 14,443 | 0.3 | $45,620 | 50.3 | 18.3 | 22.0 | 0.3 | 6.6 | |
| 11217 / Brooklyn / NY / 2.7 mi. | 47 | 15,734 | 0.3 | $49,567 | 61.3 | 24.7 | 28.8 | 0.3 | 3.8 | |
| 11559 / Lawrence / NY / 17.3 mi. | 47 | 2,645 | 1.8 | $78,572 | 11.4 | 6.2 | 2.2 | 0.1 | 1.8 | |
| 10029 / New York / NY / 6.3 mi. | 46 | 27,465 | 0.2 | $22,232 | 92.4 | 57.6 | 29.0 | 0.2 | 3.5 | |
| 10462 / Bronx / NY / 11.8 mi. | 44 | 28,252 | 0.2 | $33,735 | 78.0 | 42.0 | 24.4 | 0.3 | 7.2 | |
| 11214 / Brooklyn / NY / 8 mi. | 43 | 31,606 | 0.1 | $33,765 | 33.3 | 8.6 | 0.5 | 0.1 | 21.0 | |
| 10467 / Bronx / NY / 13.4 mi. | 41 | 34,763 | 0.1 | $29,044 | 84.9 | 42.1 | 33.4 | 0.2 | 5.4 | |
| 11226 / Brooklyn / NY / 5.5 mi. | 40 | 35,684 | 0.1 | $29,498 | 96.8 | 14.0 | 75.8 | 0.2 | 2.8 | |
| 12077 / Glenmont / NY / 130.3 mi. | 40 | 1,959 | 2.0 | $66,270 | 11.2 | 3.0 | 5.3 | 0.1 | 1.8 | |
| 10027 / New York / NY / 7.3 mi. | 37 | 22,230 | 0.2 | $23,150 | 82.3 | 22.5 | 51.0 | 0.3 | 5.8 | |
| 11211 / Brooklyn / NY / 2.8 mi. | 37 | 27,859 | 0.1 | $23,567 | 48.4 | 36.2 | 3.3 | 0.1 | 2.1 | |
| 07030 / Hoboken / NJ / 2.4 mi. | 37 | 19,418 | 0.2 | $62,550 | 29.5 | 20.2 | 3.4 | 0.1 | 4.3 | |
| 10461 / Bronx / NY / 12.7 mi. | 35 | 20,268 | 0.2 | $40,024 | 40.2 | 26.0 | 3.9 | 0.2 | 7.6 | |
| 11367 / Flushing / NY / 9.8 mi. | 34 | 14,542 | 0.2 | $45,285 | 46.6 | 15.0 | 8.2 | 0.1 | 17.0 | |
| 11717 / Brentwood / NY / 39.9 mi. | 34 | 12,081 | 0.3 | $58,985 | 74.4 | 53.1 | 16.5 | 0.3 | 2.0 | |
| 10004 / New York / NY / 0.8 mi. | 33 | 622 | 5.3 | $101,868 | 29.7 | 6.5 | 5.6 | 0.0 | 12.6 | |
| 07087 / Union City / NJ / 4 mi. | 33 | 28,847 | 0.1 | $33,132 | 80.6 | 75.3 | 1.5 | 0.1 | 2.4 | |
| 07002 / Bayonne / NJ / 6.3 mi. | 32 | 25,545 | 0.1 | $41,566 | 30.1 | 17.8 | 5.0 | 0.1 | 4.1 | |
| 11234 / Brooklyn / NY / 9.1 mi. | 32 | 31,213 | 0.1 | $51,446 | 45.1 | 7.0 | 32.7 | 0.1 | 3.3 | |
| 10472 / Bronx / NY / 10.8 mi. | 31 | 21,740 | 0.1 | $23,565 | 96.9 | 62.5 | 25.7 | 0.5 | 4.1 | |
| 11377 / Woodside / NY / 5.8 mi. | 31 | 31,599 | 0.1 | $37,360 | 74.5 | 38.1 | 2.6 | 0.2 | 29.8 | |
| 10302 / Staten Island / NY / 8.8 mi. | 29 | 5,542 | 0.5 | $42,452 | 48.7 | 25.7 | 17.6 | 0.2 | 2.8 | |
| 10468 / Bronx / NY / 12.2 mi. | 29 | 25,724 | 0.1 | $26,852 | 93.1 | 63.4 | 22.3 | 0.2 | 4.8 | |
| 11101 / Long Island City / NY / 4.3 mi. | 28 | 9,563 | 0.3 | $28,872 | 74.8 | 35.7 | 23.7 | 0.4 | 10.4 | |
| 11232 / Brooklyn / NY / 4.2 mi. | 28 | 8,492 | 0.3 | $28,395 | 82.7 | 64.0 | 4.4 | 0.3 | 10.6 | |
| 11598 / Woodmere / NY / 16.6 mi. | 28 | 4,232 | 0.7 | $99,595 | 9.8 | 4.6 | 1.6 | 0.0 | 2.9 | |
| 11801 / Hicksville / NY / 25.6 mi. | 28 | 13,154 | 0.2 | $67,226 | 19.9 | 9.5 | 0.4 | 0.1 | 8.7 | |
| 11021 / Great Neck / NY / 15.5 mi. | 27 | 8,530 | 0.3 | $70,569 | 21.4 | 7.3 | 5.8 | 0.0 | 6.4 | |
| 11238 / Brooklyn / NY / 3.4 mi. | 27 | 21,104 | 0.1 | $39,917 | 85.1 | 11.5 | 66.1 | 0.2 | 3.6 | |
| 11561 / Long Beach / NY / 21.1 mi. | 27 | 16,632 | 0.2 | $57,657 | 21.2 | 11.8 | 5.3 | 0.2 | 2.3 | |
| 07306 / Jersey City / NJ / 3.4 mi. | 26 | 20,304 | 0.1 | $34,808 | 74.6 | 29.0 | 14.7 | 0.3 | 23.4 | |
| 10033 / New York / NY / 10 mi. | 26 | 19,202 | 0.1 | $31,348 | 81.8 | 74.3 | 4.1 | 0.2 | 1.7 | |
| 11374 / Rego Park / NY / 7.8 mi. | 26 | 19,565 | 0.1 | $40,998 | 42.5 | 13.1 | 2.3 | 0.1 | 23.1 | |
| 10306 / Staten Island / NY / 11.8 mi. | 25 | 20,793 | 0.1 | $55,413 | 14.1 | 8.4 | 1.1 | 0.1 | 3.3 | |
| 11372 / Jackson Heights / NY / 7.1 mi. | 24 | 24,876 | 0.1 | $39,084 | 78.7 | 56.4 | 2.0 | 0.2 | 17.0 | |
| 11415 / Kew Gardens / NY / 9.4 mi. | 24 | 8,584 | 0.3 | $45,344 | 45.1 | 20.0 | 6.2 | 0.2 | 12.9 | |
| 11691 / Far Rockaway / NY / 15.1 mi. | 24 | 18,195 | 0.1 | $27,820 | 78.1 | 22.9 | 49.3 | 0.3 | 1.6 | |
| 11221 / Brooklyn / NY / 4.6 mi. | 23 | 25,375 | 0.1 | $22,305 | 98.9 | 34.4 | 61.0 | 0.3 | 0.9 | |
| 07307 / Jersey City / NJ / 3.6 mi. | 22 | 16,146 | 0.1 | $38,720 | 68.6 | 45.2 | 4.7 | 0.2 | 14.0 | |
| 07424 / Little Falls / NJ / 15.6 mi. | 22 | 9,084 | 0.2 | $59,611 | 15.7 | 7.7 | 1.8 | 0.1 | 4.0 | |
| 11104 / Sunnyside / NY / 5.1 mi. | 22 | 12,391 | 0.2 | $37,962 | 60.2 | 29.7 | 1.3 | 0.2 | 24.4 | |
| 11365 / Fresh Meadows / NY / 11.5 mi. | 22 | 15,875 | 0.1 | $50,744 | 53.8 | 12.5 | 10.9 | 0.1 | 27.2 | |
| 11968 / Southampton / NY / 84.6 mi. | 22 | 4,734 | 0.5 | $55,495 | 20.7 | 8.1 | 6.4 | 4.0 | 1.0 | |
| 10471 / Bronx / NY / 14 mi. | 21 | 9,733 | 0.2 | $56,488 | 30.7 | 15.1 | 7.8 | 0.1 | 5.3 | |
| 11228 / Brooklyn / NY / 6.9 mi. | 21 | 16,073 | 0.1 | $44,932 | 22.2 | 6.6 | 0.2 | 0.1 | 12.6 | |
| 11518 / East Rockaway / NY / 18.7 mi. | 21 | 4,307 | 0.5 | $57,619 | 8.4 | 5.8 | 0.4 | 0.0 | 1.6 | |
| 12210 / Albany / NY / 134.9 mi. | 21 | 4,930 | 0.4 | $25,761 | 60.2 | 6.6 | 47.0 | 0.4 | 3.0 | |
| 06902 / Stamford / CT / 33.9 mi. | 21 | 21,732 | 0.1 | $52,315 | 54.5 | 25.1 | 22.9 | 0.2 | 3.9 | |
| 10314 / Staten Island / NY / 11.2 mi. | 20 | 30,313 | 0.1 | $59,560 | 23.9 | 8.4 | 2.7 | 0.1 | 10.7 | |
| 11225 / Brooklyn / NY / 4.4 mi. | 20 | 23,418 | 0.1 | $30,192 | 93.7 | 9.0 | 80.8 | 0.2 | 0.8 | |
| 11366 / Fresh Meadows / NY / 11.4 mi. | 20 | 4,537 | 0.4 | $62,325 | 56.4 | 11.5 | 9.2 | 0.1 | 32.6 | |
| 11706 / Bay Shore / NY / 39.1 mi. | 20 | 18,632 | 0.1 | $56,128 | 46.1 | 28.4 | 12.9 | 0.2 | 2.1 | |
| 11710 / Bellmore / NY / 25 mi. | 20 | 11,558 | 0.2 | $72,813 | 8.5 | 4.0 | 1.1 | 0.1 | 2.5 | |
| 11096 / Inwood / NY / 14.5 mi. | 19 | 2,594 | 0.7 | $41,569 | 60.9 | 27.6 | 28.2 | 0.3 | 2.1 | |
| 11236 / Brooklyn / NY / 7.7 mi. | 19 | 31,730 | 0.1 | $42,370 | 85.7 | 8.8 | 69.6 | 0.2 | 3.9 | |
| 11758 / Massapequa / NY / 28.4 mi. | 19 | 18,080 | 0.1 | $76,718 | 11.2 | 4.5 | 4.3 | 0.1 | 1.4 | |
| 07102 / Newark / NJ / 8.7 mi. | 19 | 4,607 | 0.4 | $13,421 | 91.3 | 22.8 | 63.7 | 0.4 | 2.0 | |
| 06830 / Greenwich / CT / 30.7 mi. | 18 | 9,976 | 0.2 | $82,285 | 19.1 | 9.6 | 3.1 | 0.1 | 4.7 | |
| 07601 / Hackensack / NJ / 12.2 mi. | 18 | 18,113 | 0.1 | $49,316 | 60.1 | 25.9 | 23.7 | 0.2 | 7.4 | |
| 10583 / Scarsdale / NY / 22.1 mi. | 18 | 13,892 | 0.1 | $122,234 | 18.0 | 3.2 | 1.8 | 0.0 | 11.7 | |
| 11373 / Elmhurst / NY / 7 mi. | 18 | 33,089 | 0.1 | $38,151 | 86.4 | 43.1 | 1.4 | 0.2 | 38.8 | |
| 07302 / Jersey City / NJ / 2 mi. | 17 | 14,172 | 0.1 | $45,223 | 65.2 | 29.4 | 16.8 | 0.2 | 15.1 | |
| 10305 / Staten Island / NY / 8.9 mi. | 17 | 14,142 | 0.1 | $48,944 | 25.7 | 13.5 | 3.1 | 0.1 | 6.3 | |
| 10601 / White Plains / NY / 25.4 mi. | 17 | 4,021 | 0.4 | $41,201 | 62.0 | 27.4 | 25.8 | 0.2 | 5.5 | |
| 11103 / Astoria / NY / 6.2 mi. | 17 | 17,627 | 0.1 | $38,482 | 50.1 | 25.9 | 1.0 | 0.2 | 14.0 | |
| 06905 / Stamford / CT / 35.4 mi. | 17 | 8,321 | 0.2 | $67,285 | 23.5 | 7.9 | 5.7 | 0.0 | 8.2 | |
| 07036 / Linden / NJ / 13.5 mi. | 16 | 15,734 | 0.1 | $45,960 | 40.6 | 13.9 | 21.5 | 0.1 | 2.3 | |
| 07042 / Montclair / NJ / 12.9 mi. | 16 | 10,637 | 0.2 | $60,962 | 55.0 | 5.7 | 42.5 | 0.2 | 2.9 | |
| 07470 / Wayne / NJ / 20.3 mi. | 16 | 18,755 | 0.1 | $83,651 | 13.5 | 5.1 | 1.6 | 0.1 | 5.7 | |
| 07505 / Paterson / NJ / 16.3 mi. | 16 | 782 | 2.0 | $24,135 | 89.3 | 46.9 | 39.8 | 0.2 | 1.1 | |
| 10960 / Nyack / NY / 26.6 mi. | 16 | 6,027 | 0.3 | $60,766 | 35.7 | 7.6 | 20.7 | 0.1 | 3.7 | |
| 11023 / Great Neck / NY / 15.6 mi. | 16 | 2,991 | 0.5 | $97,364 | 12.3 | 3.8 | 1.1 | 0.0 | 5.2 | |
| 11357 / Whitestone / NY / 11.5 mi. | 16 | 15,386 | 0.1 | $54,910 | 22.3 | 7.7 | 0.3 | 0.1 | 12.4 | |
| 11779 / Ronkonkoma / NY / 46.9 mi. | 16 | 13,057 | 0.1 | $64,036 | 11.5 | 6.4 | 1.1 | 0.1 | 2.6 | |
| 07304 / Jersey City / NJ / 3.1 mi. | 15 | 14,588 | 0.1 | $31,685 | 87.7 | 25.8 | 44.4 | 0.3 | 12.2 | |
| 10034 / New York / NY / 11.6 mi. | 15 | 15,281 | 0.1 | $29,479 | 84.5 | 73.9 | 7.0 | 0.2 | 1.7 | |
| 10312 / Staten Island / NY / 14.7 mi. | 15 | 20,056 | 0.1 | $67,728 | 11.1 | 5.7 | 0.6 | 0.1 | 3.9 | |
| 11030 / Manhasset / NY / 17.7 mi. | 15 | 5,864 | 0.3 | $125,425 | 14.2 | 3.4 | 1.2 | 0.0 | 8.7 | |
| 11207 / Brooklyn / NY / 6.8 mi. | 15 | 27,673 | 0.1 | $24,163 | 98.6 | 33.8 | 61.2 | 0.3 | 1.0 | |
| 11530 / Garden City / NY / 19.7 mi. | 15 | 9,111 | 0.2 | $97,918 | 8.5 | 3.2 | 1.4 | 0.0 | 3.2 | |
| 11554 / East Meadow / NY / 23.5 mi. | 15 | 12,185 | 0.1 | $67,185 | 19.0 | 7.0 | 4.0 | 0.1 | 6.7 | |
| 11557 / Hewlett / NY / 17.5 mi. | 15 | 2,852 | 0.5 | $88,075 | 11.9 | 5.5 | 0.7 | 0.1 | 4.9 | |
| 11963 / Sag Harbor / NY / 90.8 mi. | 15 | 2,960 | 0.5 | $54,966 | 10.9 | 5.2 | 3.3 | 0.2 | 0.8 | |
| 07032 / Kearny / NJ / 6.6 mi. | 15 | 13,550 | 0.1 | $47,757 | 39.7 | 27.4 | 3.6 | 0.1 | 5.5 | |
| 07094 / Secaucus / NJ / 5.4 mi. | 14 | 6,214 | 0.2 | $59,800 | 29.9 | 12.3 | 4.1 | 0.1 | 11.8 | |
| 10977 / Spring Valley / NY / 28.1 mi. | 14 | 13,662 | 0.1 | $53,473 | 54.5 | 11.4 | 32.4 | 0.2 | 6.9 | |
| 11203 / Brooklyn / NY / 6 mi. | 14 | 27,838 | 0.1 | $37,341 | 97.7 | 4.9 | 89.0 | 0.2 | 1.0 | |
| 11566 / Merrick / NY / 24 mi. | 14 | 11,806 | 0.1 | $87,842 | 8.0 | 3.7 | 0.7 | 0.1 | 2.6 | |
| 11580 / Valley Stream / NY / 16.2 mi. | 14 | 12,585 | 0.1 | $63,802 | 38.4 | 13.2 | 14.2 | 0.2 | 8.2 | |
| 11901 / Riverhead / NY / 73.4 mi. | 14 | 8,447 | 0.2 | $38,472 | 31.9 | 9.0 | 19.8 | 0.6 | 0.9 | |
| 11937 / East Hampton / NY / 97.2 mi. | 14 | 5,325 | 0.3 | $55,414 | 21.2 | 13.8 | 3.4 | 0.1 | 1.5 | |
| 07201 / Elizabeth / NJ / 9.4 mi. | 13 | 8,300 | 0.2 | $33,088 | 81.7 | 44.5 | 32.2 | 0.1 | 1.1 | |
| 08902 / North Brunswick / NJ / 30.8 mi. | 13 | 13,879 | 0.1 | $61,277 | 41.6 | 10.3 | 14.7 | 0.1 | 14.0 | |
| 10538 / Larchmont / NY / 20.3 mi. | 13 | 6,322 | 0.2 | $111,492 | 10.8 | 4.8 | 1.5 | 0.0 | 3.1 | |
| 10990 / Warwick / NY / 42.4 mi. | 13 | 6,540 | 0.2 | $67,194 | 14.4 | 6.7 | 5.4 | 0.2 | 0.9 | |
| 11050 / Port Washington / NY / 18.7 mi. | 13 | 10,450 | 0.1 | $85,086 | 23.7 | 11.7 | 2.0 | 0.1 | 8.5 | |
| 11379 / Middle Village / NY / 6.8 mi. | 13 | 11,719 | 0.1 | $49,083 | 16.2 | 9.8 | 0.6 | 0.1 | 4.0 | |
| 11426 / Bellerose / NY / 15.1 mi. | 13 | 6,307 | 0.2 | $58,065 | 45.3 | 13.6 | 5.4 | 0.3 | 22.4 | |
| 11435 / Jamaica / NY / 10.5 mi. | 13 | 17,622 | 0.1 | $40,157 | 83.5 | 29.3 | 31.4 | 0.5 | 14.4 | |
| File | ny_the_new_york_sun | |||||||||
| Time | 5/19/05 4:30 PM | |||||||||
| Page | 232 | |||||||||
| Member | 130555 | |||||||||