
|
| Comparing the racial diversity of the journalists | ||||||||||
| at America's daily newspapers | ||||||||||
| with the communities that they serve | ||||||||||
| Newsroom diversity report for | ||||||||||
| The Daily Star, Hammond | ||||||||||
| Hammond, Louisiana | ||||||||||
| Owner: Paxton Media Group (Ky.) | ||||||||||
| From a report for the Knight Foundation | ||||||||||
| by Bill Dedman and Stephen K. Doig, June 2005 | ||||||||||
| Click here to read the national report or to select another newspaper | ||||||||||
| Year | Non-white % of newsroom staff | 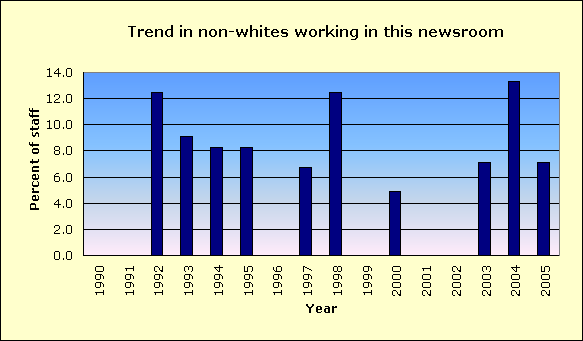
|
||||||||
| 2005 | 7.1 | |||||||||
| 2004 | 13.3 | |||||||||
| 2003 | 7.1 | |||||||||
| 2002 | 0.0 | |||||||||
| 2001 | 0.0 | |||||||||
| 2000 | 4.9 | |||||||||
| 1999 | 0.0 | |||||||||
| 1998 | 12.5 | |||||||||
| 1997 | 6.7 | |||||||||
| 1996 | 0.0 | |||||||||
| 1995 | 8.3 | |||||||||
| 1994 | 8.3 | |||||||||
| 1993 | 9.1 | |||||||||
| 1992 | 12.5 | |||||||||
| 1991 | Did not report | |||||||||
| 1990 | 0.0 | |||||||||
| The latest year at peak is | 2004 | |||||||||
| See the notes and definitions section below for the sources of these figures. | ||||||||||
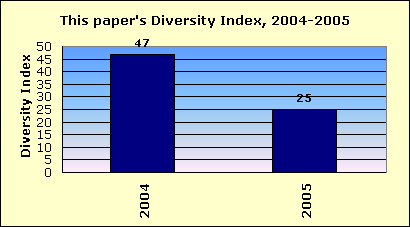
| Newsroom Diversity Index | ||||||||||
| for The Daily Star, Hammond | ||||||||||
 |
||||||||||
| Year | Non-white % of newsroom staff | Non-white % of circulation area | Newsroom Diversity Index (parity=100) | |||||||
| 2005 | 7.1 | 28.5 | 25 | |||||||
| 2004 | 13.3 | 28.5 | 47 | |||||||
| How the index is calculated | ||||||||||
| The Newsroom Diversity Index is the non-white percentage of the newsroom staff | ||||||||||
| divided by the non-white percentage of residents in the circulation area. | ||||||||||
| (Parity = 100.) | ||||||||||
| Company index | ||||||||||
| This newspaper's owner, Paxton Media Group (Ky.), | ||||||||||
| has a companywide, circulation-weighted Diversity Index of 18. | ||||||||||
| See the notes and definitions section below for the sources of these figures. | ||||||||||
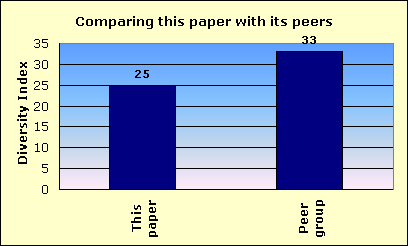
| Peer group comparison | ||||||||||
| for The Daily Star, Hammond | ||||||||||
 |
||||||||||
| This newspaper's Newsroom Diversity Index is 25. | This paper | |||||||||
| Peer group | ||||||||||
| Compare that with 33, which is the median Diversity Index for all newspapers | ||||||||||
| reporting in this circulation category of 10,001 to 25,000 daily sales. | ||||||||||
| In that group, this newspaper's Diversity Index ranks 141 out of 259 | ||||||||||
| newspapers reporting in the category of 10,001 to 25,000 daily sales. | ||||||||||
| An example of a newspaper of similar circulation, in an area of similar level of non-white residents, but one that has a relatively high Diversity Index, is Greeley Tribune, Colorado, with a 26.3 percent non-white staff in a community that is 30 percent non-white. Its index is 88. | ||||||||||
| FYI, in circulation, this newspaper's average weekday circulation of | ||||||||||
| approximately 10,527 ranks 765 out of 1,410 daily newspapers in the US. | ||||||||||
| See the notes and definitions section below for the sources of these figures. | ||||||||||
| Details on race/ethnicity | ||||||||||
| in the circulation area | ||||||||||
| and the home county | ||||||||||
| of The Daily Star, Hammond | ||||||||||
| Circulation area | ||||||||||
| Race/ethnicity | % of population | Number of residents | 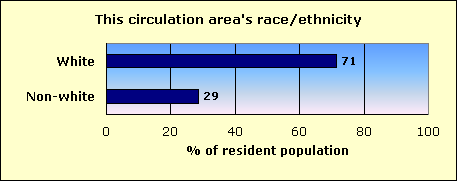
|
|||||||
| Hispanic | 1.4 | 1,716 | ||||||||
| Black | 25.8 | 30,772 | ||||||||
| Asian and Pacific Islander | 0.3 | 404 | ||||||||
| Native-American | 0.2 | 278 | ||||||||
| Other non-white | 0.1 | 67 | ||||||||
| Multi-racial | 0.7 | 818 | ||||||||
| Non-white | 28.5 | 34,055 | ||||||||
| White | 71.5 | 85,354 | ||||||||
| Total | 119,409 | |||||||||
| Home county: Tangipahoa | ||||||||||
| Race/ethnicity | % of population | Number of residents | 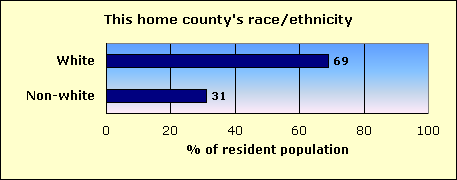
|
|||||||
| Hispanic | 1.5 | 1,536 | ||||||||
| Black | 28.2 | 28,388 | ||||||||
| Asian and Pacific Islander | 0.4 | 392 | ||||||||
| Native-American | 0.2 | 222 | ||||||||
| Other non-white | 0.1 | 62 | ||||||||
| Multi-racial | 0.7 | 688 | ||||||||
| Non-white | 31.1 | 31,288 | ||||||||
| White | 68.9 | 69,300 | ||||||||
| Total | 100,588 | |||||||||
| The home county of this newspaper is Tangipahoa. | ||||||||||
| About this report | ||||||||||
| This third annual report for the Knight Foundation adds context to an annual survey by the American Society of Newspaper Editors. ASNE has set a goal that | ||||||||||
| every newspaper, to help it know its community and gather the news, should employ at least one non-white journalist, and that newspapers should strive to | ||||||||||
| employ non-whites in proportion to their share of the community. ASNE's report, at www.asne.org, shows each newspaper's non-white employment, but does | ||||||||||
| not disclose how closely that employment mirrors the newspaper's circulation area. | ||||||||||
| That gap is filled by the report you are reading now. This report was not done by ASNE, but was done for the Knight Foundation by Bill Dedman and | ||||||||||
| Stephen K. Doig. It shows how close each newspaper is to ASNE's goal, by comparing the newsroom staffing with the circulation area population. | ||||||||||
| The full report is at www.powerreporting.com/knight. | ||||||||||
| Notes and definitions | ||||||||||
| 1. The Newsroom Diversity Index is the non-white percentage of the newsroom staff divided by the non-white percentage of the circulation area's residents. Parity = 100. | ||||||||||
| 2. Source for staffing: Survey by American Society of Newspaper Editors, April 2005. Newspapers report non-white staff as of the end of the previous year. | ||||||||||
| 3. Following ASNE's definition, newsroom staff includes only supervisors, reporters, editors, copy/layout editors and photographers. | ||||||||||
| 4. Also following ASNE's definition, "whites," "blacks," etc., exclude Hispanics, who are counted in a separate category. | ||||||||||
| 5. Source for boundaries of this newspaper's circulation area: ZIP Code circulation data, Audit Bureau of Circulations, latest available. | ||||||||||
| 6. A paper may define its circulation area differently for marketing efforts, or news coverage, or to set advertising rates. | ||||||||||
| 7. If ZIP Codes or counties are used, this report applies a threshold: 10 percent household penetration is required to include an area in the circulation area. | ||||||||||
| 8. Source for the demographics of residents of that circulation area: US Census 2000. | ||||||||||
| 9. Source for total circulation: Editor & Publisher magazine, Monday-Friday average at year-end 2004. | ||||||||||
| 10. Staff of non-English publications, such as the Miami Herald's El Nuevo Herald, are excluded from the ASNE staffing survey for the first time this year. | ||||||||||
| Demographics of ZIP Codes | ||||||||||
| where sales were reported by | ||||||||||
| The Daily Star, Hammond | ||||||||||
| Note that some ZIP Codes listed here may not have been included in determining the newspaper's circulation area. In calculating the Diversity Index, a | ||||||||||
| ZIP Code was included only if the household penetration was at least 10 percent. Any lower-penetration ZIP Codes are also listed here for your information. | ||||||||||
| Also, if the newspaper reported more than 300 ZIP Codes, only the top 300 in weekday sales are listed here. | ||||||||||
| ZIP / City / State / Approx. distance in miles from the newspaper's home office | Weekday sales | Households | Penetration % (daily sales per 100 households) | Median household income | Non-white % of population |
Hispanic % of population |
Black % of population |
Native % of population |
Asian % of population |
|
| 70403 / Hammond / LA / 0 mi. | 3,088 | 7,441 | 41.5 | $28,767 | 37.0 | 1.4 | 34.2 | 0.3 | 0.6 | |
| 70454 / Ponchatoula / LA / 8.6 mi. | 2,401 | 7,231 | 33.2 | $33,210 | 15.2 | 1.0 | 13.0 | 0.2 | 0.3 | |
| 70401 / Hammond / LA / 3.8 mi. | 1,783 | 6,936 | 25.7 | $27,255 | 35.9 | 2.0 | 32.1 | 0.2 | 0.6 | |
| 70443 / Independence / LA / 11.5 mi. | 1,004 | 3,364 | 29.8 | $29,359 | 29.8 | 2.0 | 26.5 | 0.3 | 0.3 | |
| 70466 / Tickfaw / LA / 6.1 mi. | 794 | 2,347 | 33.8 | $30,344 | 20.4 | 2.6 | 16.5 | 0.3 | 0.2 | |
| 70422 / Amite / LA / 20.6 mi. | 785 | 4,306 | 18.2 | $29,727 | 43.5 | 1.2 | 41.2 | 0.2 | 0.3 | |
| 70446 / Loranger / LA / 14 mi. | 477 | 1,691 | 28.2 | $36,176 | 12.0 | 1.6 | 8.7 | 0.4 | 0.2 | |
| 70711 / Albany / LA / 7.8 mi. | 447 | 1,395 | 32.0 | $33,103 | 12.8 | 1.5 | 9.5 | 0.6 | 0.1 | |
| 70462 / Springfield / LA / 9.9 mi. | 415 | 1,715 | 24.2 | $31,148 | 18.1 | 0.6 | 16.7 | 0.2 | 0.1 | |
| 70444 / Kentwood / LA / 27.7 mi. | 405 | 3,627 | 11.2 | $27,899 | 35.5 | 0.9 | 33.8 | 0.1 | 0.2 | |
| 70744 / Holden / LA / 12.4 mi. | 210 | 1,679 | 12.5 | $32,917 | 4.3 | 1.1 | 2.3 | 0.2 | 0.0 | |
| 70455 / Robert / LA / 9.6 mi. | 159 | 498 | 31.9 | $27,083 | 4.6 | 1.6 | 1.9 | 0.3 | 0.0 | |
| 70456 / Roseland / LA / 21.5 mi. | 137 | 1,046 | 13.1 | $23,049 | 58.5 | 0.9 | 56.2 | 0.3 | 0.2 | |
| 70451 / Natalbany / LA / 4.5 mi. | 54 | 71 | 76.1 | $40,227 | 23.4 | 2.9 | 19.4 | 0.0 | 0.0 | |
| 70442 / Husser / LA / 16.2 mi. | 49 | 131 | 37.4 | $30,000 | 3.6 | 0.0 | 2.8 | 0.6 | 0.0 | |
| 70437 / Folsom / LA / 20 mi. | 47 | 2,203 | 2.1 | $40,478 | 17.8 | 3.0 | 13.5 | 0.4 | 0.2 | |
| File | la_the_daily_star__hammond | |||||||||
| Time | 5/21/05 10:06 PM | |||||||||
| Page | 764 | |||||||||
| Member | 117850 | |||||||||